Health5 min readUpdated Apr 25, 2026

Biological Age vs Chronological Age: Real Health in 2026

The Calculory Team

Preventive Health and Analytics

Biological age tracks how fast your body is aging, not just how many birthdays you have had. Learn how it is calculated in 2026 and how to lower it with measurable habits.

Biological Age vs Chronological Age: Real Health in 2026

Key Takeaways

  • Two people with the same chronological age can differ by 8 to 15 biological years when inflammation, glucose, and recovery quality diverge.
  • PhenoAge models use 9 common blood biomarkers plus chronological age, giving a practical baseline without waiting for specialized DNA testing.
  • Epigenetic clocks are still the 2026 research gold standard for precision aging estimates, but they usually cost more and update less frequently than blood panels.
  • Weekly habit tracking can meaningfully shift biological age trend direction within 8 to 12 weeks when sleep consistency, glucose control, and activity all improve together.
  • Women often need life-stage specific interpretation because cycle phase, perimenopause transitions, and hormone variability can change biomarker readings.
  • The fastest practical start is to run your baseline in the [Biological Age Calculator](/calculators/health/biological-age-calculator), then recheck every 8 to 12 weeks using comparable lab conditions.

Quick Comparison

1

The 2026 Health Shift: From Lifespan to Healthspan

Health strategy in 2026 is shifting from total years lived to quality years lived. That is why chronological age alone is now treated as context, not the core score.

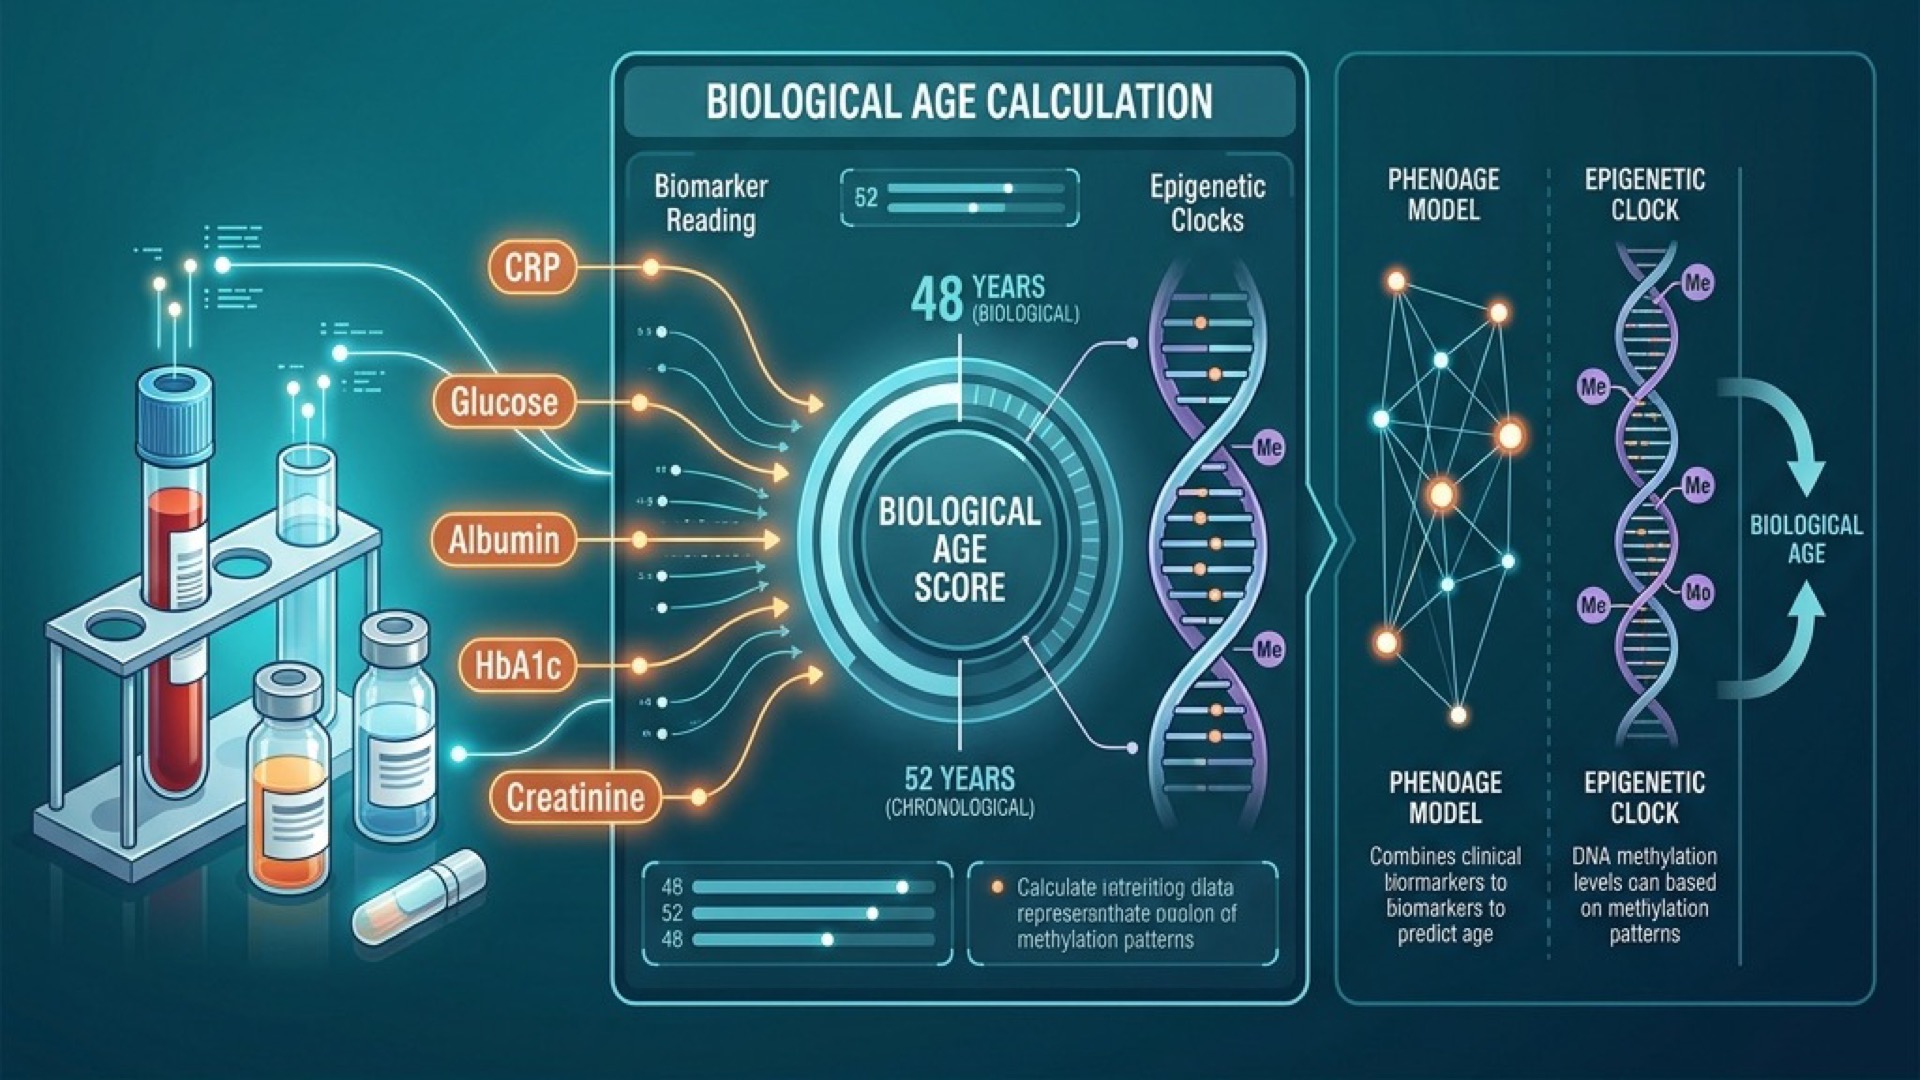
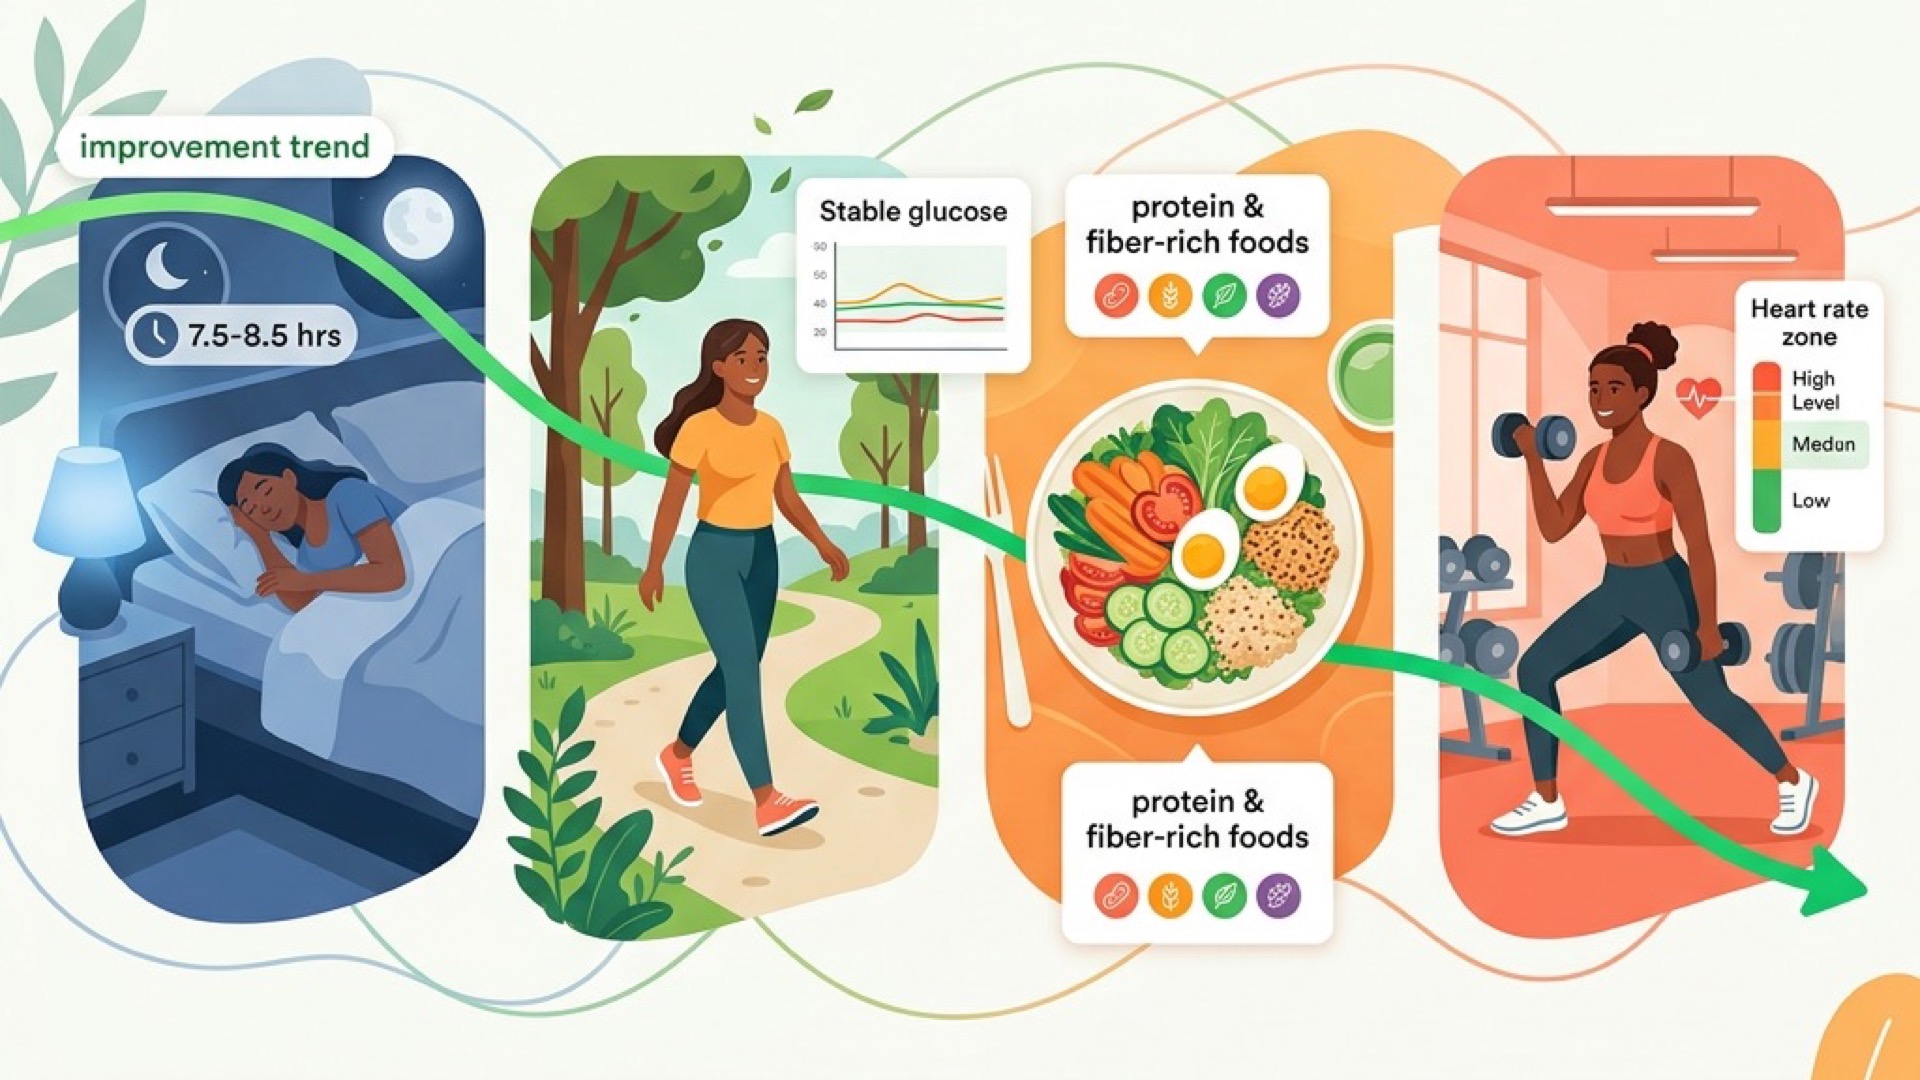
Biological age measures physiological decline. Unlike chronological age, it can be improved through sleep optimization and inflammation control.

Chronological age only counts time. Biological age estimates how your organs, metabolism, and immune system are functioning right now, which is far more useful for prevention planning.

MetricWhat It MeasuresChanges With Lifestyle?Clinical Usefulness
Chronological ageYears since birthNoLow for personalization
Biological agePhysiological wear and recoveryYesHigh for risk tracking
Healthspan scoreFunction across systemsYesHigh for interventions

If your aim is actionable tracking, pair age metrics with a baseline on BMI Calculator and Body Fat Calculator so body composition context is not missed.

2

How Biological Age Is Calculated in Practice

Biological age calculation infographic showing blood biomarkers like CRP, glucose, albumin, and HbA1c flowing into a central biological age score dial, with PhenoAge model and epigenetic clock DNA methylation comparison panels

Most practical models estimate biological age from biomarker patterns linked to long-term mortality and functional decline. The strongest consumer workflows in 2026 combine routine blood work with periodic advanced testing.

Phenotypic aging models such as PhenoAge use markers like CRP, albumin, glucose, and white blood cell count to estimate biological wear. This is useful because those labs are common, affordable, and repeatable.

Model FamilyInputsRelative CostUpdate FrequencyBest Use
Phenotypic blood modelRoutine lab panelLow to mediumEvery 8 to 12 weeksOperational monitoring
Epigenetic clockDNA methylation sampleMedium to highEvery 3 to 6 monthsDeep precision benchmarking
Microbiome AI modelStool plus behavior dataMediumMonthly to quarterlyGut and inflammation trend signals

The Biological Age Calculator gives a practical first-pass estimate from common biomarkers. For metabolic context, combine that with BMR Calculator and TDEE Calculator to understand whether intake and expenditure patterns are helping or hurting recovery.

3

The 2026 Gold Standard and the Role of AI Modeling

Epigenetic clocks remain the scientific benchmark for high-fidelity aging estimates in 2026. However, frequent day-to-day guidance still depends on lower-friction models that can update faster.

This is where AI-based metabolic tracking becomes useful. Non-linear models can detect combinations that linear scoring often misses, such as high glucose variability plus poor sleep consistency despite normal average glucose.

Signal TypeLinear Score LimitationAI Non-Linear Advantage
Glucose variabilityAverage can look normalCaptures spikes and instability patterns
Inflammation plus stressSingle marker may understate riskDetects compounding effects across markers
Sleep plus recovery loadHard to score in one ruleLearns sequence-level relationships

Calculory AI uses these pattern-based approaches to surface trend direction, not just one static number. In practice, trend slope over 8 to 12 weeks is usually more useful than a one-off result.

4

Comparison: Choosing the Right Longevity Tracking Tool

You do not need every test at once. Start with the tool that matches your budget, frequency, and decision needs.

A simple comparison makes selection easier than reading feature pages one by one. Use this structure if you are building your own pSEO cluster pages: "Tool Name vs Competitor for Biological Age Tracking."

Tool TypeTypical PriceRequired BiomarkersInterpretabilityBest For
Blood-based estimator$0 to $80 plus labsCRP, glucose, albumin, CBC/CMP setHighFrequent practical tracking
DNA methylation kit$150 to $400Saliva or blood DNA sampleMediumQuarterly precision snapshots
Microbiome longevity panel$120 to $300Microbiome plus survey dataMediumGut-driven intervention planning
Hybrid AI dashboard$20 to $120 monthlyWearables plus labsHigh if modeled wellContinuous feedback loops

For a baseline now, start with the Biological Age Calculator. Then layer advanced tests only when they change your decision quality, not just your data volume.

5

Actionable Steps to Lower Your Biological Age

Four connected lifestyle habits to lower biological age: sleeping 7.5 to 8.5 hours with calming blue glow, post-meal walking with stable glucose graph, protein and fiber-rich meal plate, and resistance training with heart rate zone indicator, linked by a green improvement trend line

Lowering biological age is usually a systems problem, not a single supplement problem. The biggest gains come from stacking sleep, inflammation control, and glucose stability in the same plan.

Start with a 12-week cycle so your interventions have enough time to move biomarkers. Weekly adjustments are useful, but biomarker re-testing too early often adds noise.

InterventionTarget RangeTracking CadencePrimary Biomarker Impact
Sleep regularity7.5 to 8.5 hours nightlyDailyCRP, fasting glucose, recovery markers
Post-meal walking10 to 15 minutes after mealsDailyGlucose variability
Protein and fiber first meals25 to 40g protein, 25g+ fiber/dayDailyInsulin and satiety stability
Zone 2 plus resistance training150 minutes plus 2 sessions weeklyWeeklyMetabolic flexibility and inflammation

Use Calorie Calculator plus Calorie Deficit Calculator only as guardrails, then validate your response with biomarker trends instead of scale weight alone.

6

Why Women Need Life-Stage Specific Longevity Diagnostics

Women often receive less accurate longevity guidance when models ignore life-stage biology. Biomarker interpretation should account for menstrual cycle phase, perimenopause transition, and postmenopause changes.

The 2026 trend often called ovarian command central reflects this shift toward stage-aware diagnostics. The same CRP or glucose reading can imply different intervention priorities depending on endocrine context.

Life StageCommon Signal ShiftPractical Adjustment
Reproductive yearsCycle-linked inflammation variabilityTest at consistent cycle timing
PerimenopauseSleep disruption and glucose instabilityPrioritize sleep and post-meal glucose control
PostmenopauseBody composition redistributionIncrease resistance training and protein quality

This does not require complicated routines. It requires consistent measurement timing and interpretation that matches the stage.

7

Build Your 90-Day Biological Age Plan

A short execution cycle beats indefinite tracking with no decisions. Run this process every 90 days so each cycle ends with a concrete adjustment.

The framework below keeps cost and effort realistic while still producing meaningful signal quality.

  1. 1.Week 0: Run baseline labs and your Biological Age Calculator.
  2. 2.Weeks 1 to 4: Lock sleep timing and meal timing before adding new interventions.
  3. 3.Weeks 5 to 8: Add one training upgrade and one glucose-stability habit.
  4. 4.Weeks 9 to 12: Re-test biomarkers under similar conditions and compare trend direction.
Cycle MilestoneMain QuestionDecision Rule
BaselineWhere am I now?Set 2 to 3 priority levers only
Mid-cycle checkAm I consistent?Fix adherence before adding tools
RetestIs trend improving?Keep what works, replace one weak lever

Keep your strategy simple: if two cycles in a row show no improvement, reduce complexity and focus on sleep consistency, glucose stability, and training recovery before adding new tests.

8

Conclusion: Your Real Health Age Is a Moving Metric

Chronological age is fixed, but biological age is trainable. That single distinction makes it one of the most useful 2026 health metrics for prevention and long-term performance.

Start with one reliable baseline, track trends not headlines, and run interventions long enough to produce real biomarker movement. If you stay consistent for 90 days, you will have better data and better decisions than most people chasing one-off longevity hacks.

Frequently Asked Questions

What is the difference between biological age and chronological age?

Chronological age is how many years you have lived. Biological age estimates how fast your body is aging based on biomarkers such as inflammation, glucose, and blood chemistry.

Can biological age really go down?

Yes, trend improvements are possible when sleep quality, metabolic control, and inflammation all improve together. Many people see direction changes in 8 to 12 weeks when interventions are consistent and labs are repeated under similar conditions.

How often should I retest biological age biomarkers?

For blood-based models, every 8 to 12 weeks is usually practical. Testing sooner can create noise, while waiting more than 6 months often slows down decision-making.

Are epigenetic clock tests better than blood-based calculators?

Epigenetic clocks are generally more precise for deep aging research snapshots. Blood-based models are often better for frequent operational tracking because they are cheaper and easier to repeat.

How much does biological age tracking cost per cycle?

A basic cycle can start near $0 if you already have recent lab values plus a free estimator. A fuller cycle with private labs and one advanced panel often ranges from about $120 to $500 per 90-day round, depending on location and test depth.

What is the fastest first step if I am new to longevity tracking?

Run a baseline estimate, pick two habits, and commit for 12 weeks. For most beginners, fixed sleep timing plus post-meal walking gives faster measurable change than chasing many supplements at once.

Author Spotlight

The Calculory Team

Preventive Health and Analytics

We translate clinical metrics into practical tools so you can track health trends early and make better day-to-day decisions.

Verified Expert Educator
biological agechronological agebiological age calculatorhealthspanlongevity trackingaging biomarkersepigenetic clockmetabolic healthpreventive healthwellness2026