Business4 min readUpdated Apr 25, 2026

Circular TCO vs Circular Savings: Payback Blueprint 2026

The Calculory Team

Circular Economy and ROI Analysis

Compare linear ownership costs against circular savings with a practical 2026 model. Calculate annualized cost, lifetime savings, and payback months for sustainable investments.

Circular TCO vs Circular Savings: Payback Blueprint 2026

Key Takeaways

  • The most useful 2026 circular metric is payback period in months, because users want a clear timeline to break-even.
  • Circular products often cost more upfront but can win over lifecycle cost through longer lifespan, residual value, and lower maintenance.
  • A simple annualized model makes decisions comparable across product types from batteries to modular furniture.
  • Carbon tax offsets now materially change B2B economics, especially for energy-intensive operations.
  • Repair decisions can be automated with a yearly cost comparison rule, helping users avoid unnecessary replacement spending.
  • A scalable pSEO system can generate 100+ intent pages by combining product, business type, and ROI intent modifiers.

Quick Comparison

1

Why Circular TCO Matters in 2026

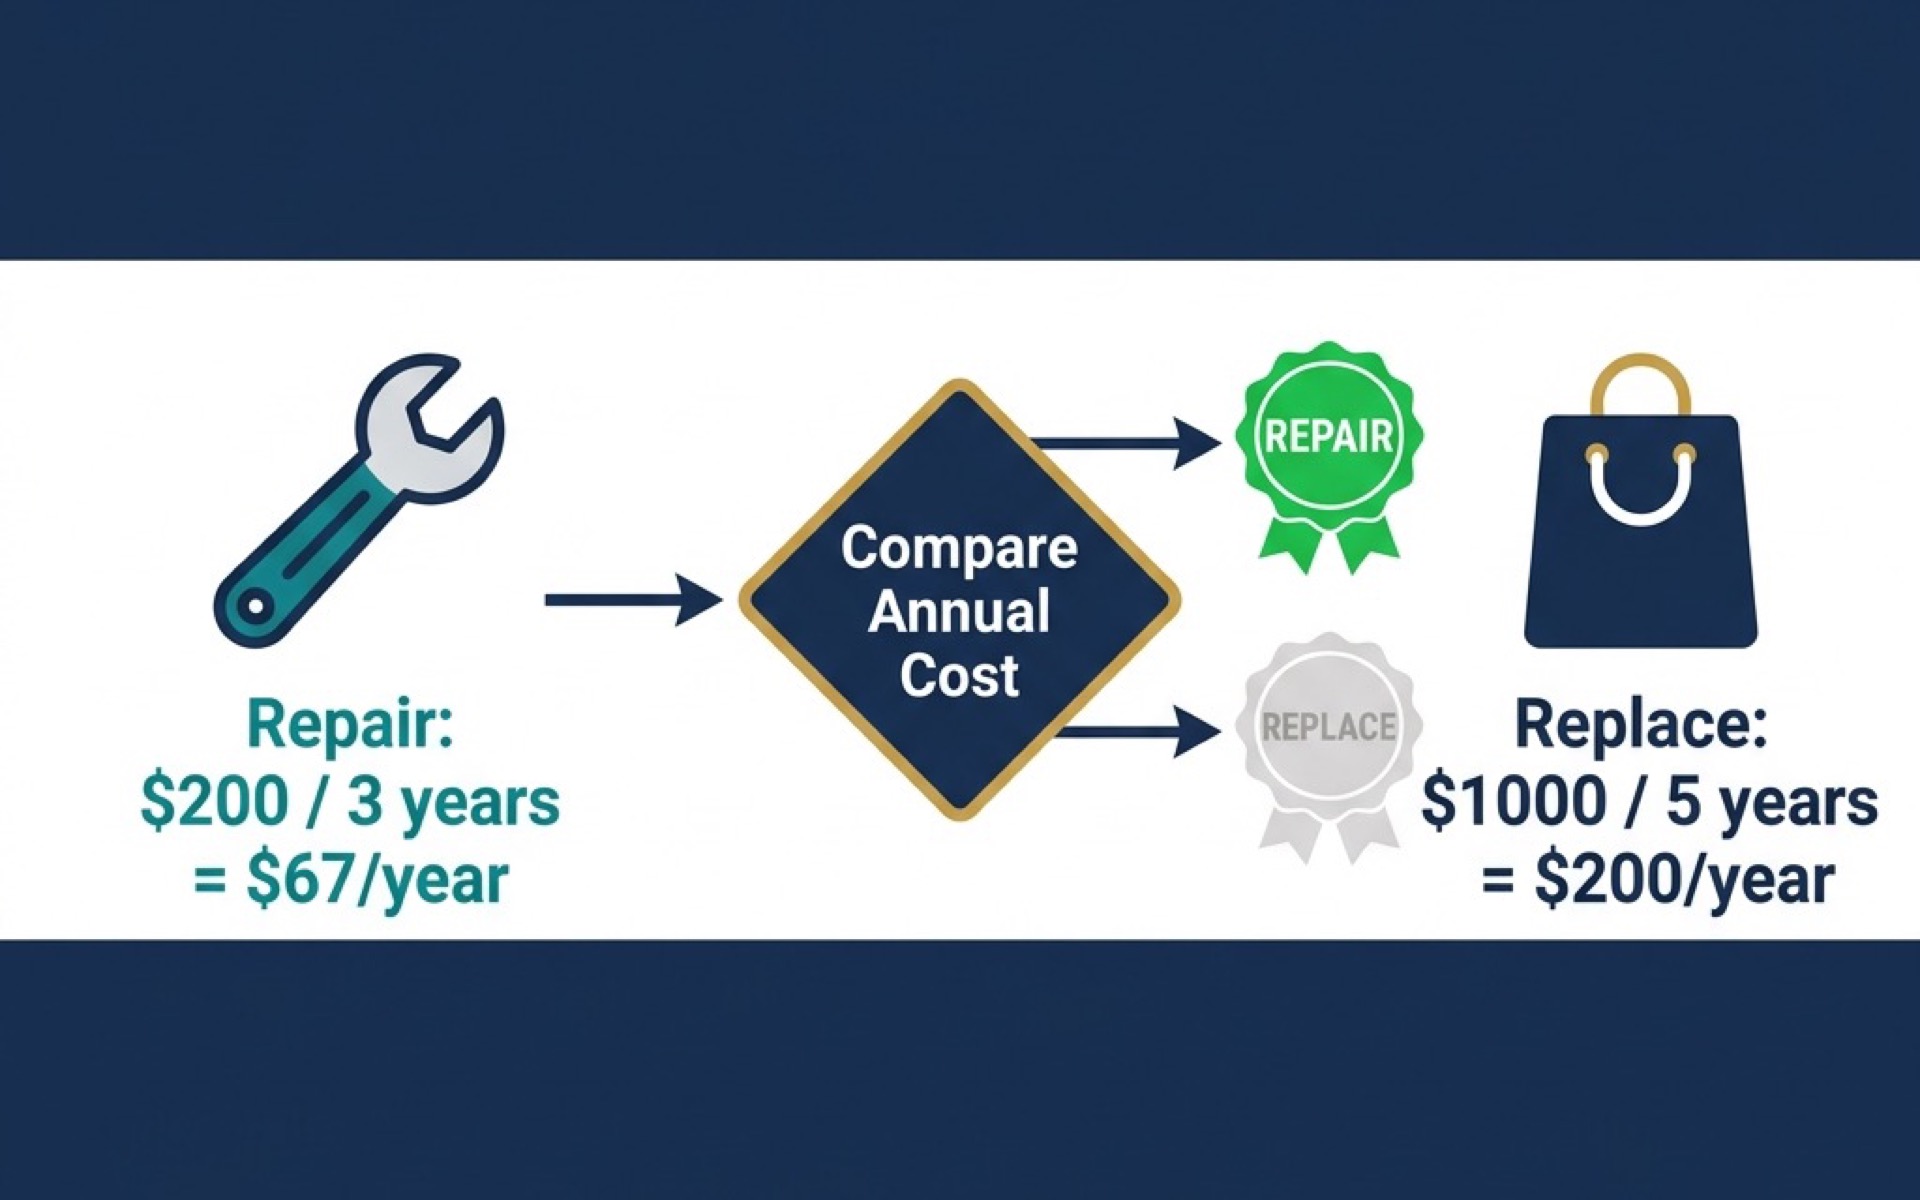
Circular economics is no longer a branding exercise. In 2026, users and finance teams want one clear answer: how many months until this sustainable choice pays for itself?

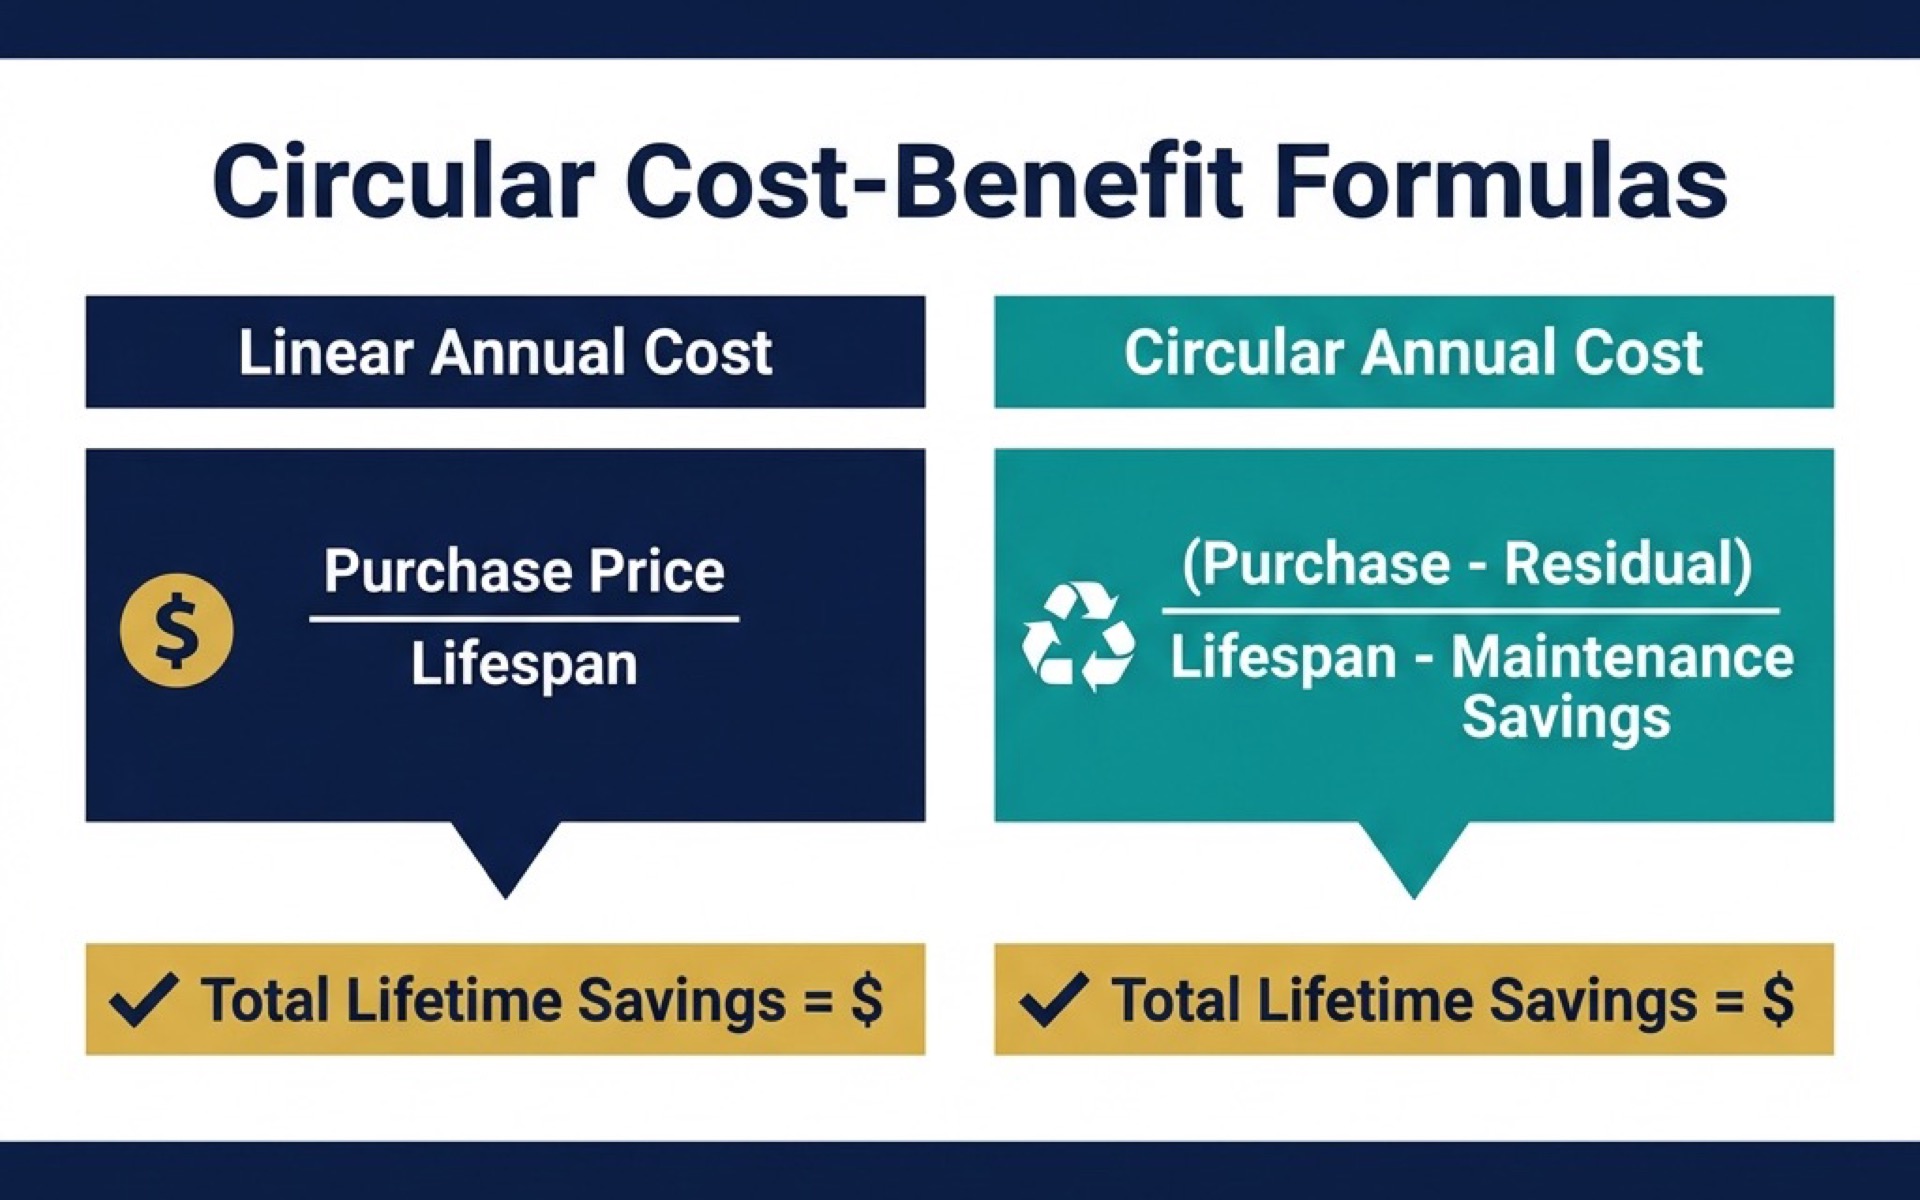
The core decision is linear model vs circular model. Linear means buy, use, toss. Circular means buy or rent, use longer, then repair, resell, or recover value at end-of-life.

ModelUpfront CostLifetime PatternEnd-of-Life Value
LinearUsually lowerShorter lifecycle and repeat purchasesOften near $0
CircularUsually higherLonger lifecycle and lower replacement frequencyResidual resale or recovery value

Start with a baseline on ROI Calculator, then layer circular-specific variables such as residual value and maintenance savings for a true ownership comparison.

2

The Circular Cost-Benefit Logic and Formula Set

Infographic comparing linear annual cost formula (purchase price divided by lifespan) against circular annual cost formula (purchase minus residual value divided by lifespan minus maintenance savings) with total lifetime savings result highlighted in gold

The model compares annualized ownership costs before projecting lifetime savings. This keeps the comparison fair when product lifespans are different.

Variables

  • Pl = Purchase price of a linear product
  • Ll = Lifespan of linear product in years
  • Pc = Purchase price of a circular product
  • Lc = Lifespan of circular product in years
  • Rv = Residual value at end of use
  • Ms = Maintenance savings per year

Step 1: Annual Cost of Linear Model

ACl = Pl / Ll

Step 2: Annual Cost of Circular Model

ACc = (Pc - Rv) / Lc - Ms

Step 3: Total Lifetime Savings Over Circular Lifespan

S = (ACl x Lc) - (ACc x Lc)

Output MetricInterpretationDecision Use
AClYearly cost of linear ownershipBaseline benchmark
ACcYearly cost of circular ownershipCircular efficiency test
STotal savings across circular lifespanInvestment justification

Use Break-Even Calculator if you want to align circular payback with broader operating margin targets.

3

Sample Use Case: Solar Storage vs Grid Power

A small office in 2026 compares staying on grid-only power against a circular solar plus battery setup. The business goal is simple: lower long-run ownership cost without guesswork.

Scenario assumptions:

  • Linear (Grid): $0 upfront, $4,000 per year utility spend, 10-year horizon
  • Circular (Solar): $15,000 upfront, $200 per year maintenance, $5,000 government rebate, $2,000 residual battery value after 10 years
Scenario10-Year CostNotes
Linear grid model$40,000$4,000 x 10 years
Circular solar model$13,200($15,000 - $5,000 rebate) + ($200 x 10) - $2,000 residual + other operational assumptions
Total savings$26,800Circular wins on lifecycle economics

This is why payback period becomes the headline metric in user-facing tools. You can model a related scenario with Solar Savings Calculator and CA Solar ROI Calculator.

4

UI Logic Feature 1: Depreciation Slider for Residual Value

Residual value drives circular ROI more than most users expect. A depreciation slider turns this into an intuitive visual lesson: better build quality usually means stronger resale value.

Example behavior:

  • Premium brand device keeps higher residual value after three years
  • Commodity alternative trends toward low residual value
Slider InputModel EffectUser Insight
Higher residual valueLowers circular annual costQuality compounds into savings
Lower residual valueRaises circular annual costCheap upfront can be expensive later

For users comparing energy assets, this pairs well with Battery Backup Calculator to connect asset specification with lifecycle value.

5

UI Logic Feature 2: Carbon Tax Offset for B2B

In 2026, carbon penalties can materially alter ownership economics for business users. Circular investments may reduce emissions enough to create direct tax or compliance savings.

Add this input to your calculator:

  • Annual carbon footprint (tons)
  • Carbon tax rate per ton
  • Circular emissions reduction percentage

Then subtract projected carbon-tax savings from circular model cost.

Carbon InputCalculation EffectBusiness Outcome
Higher baseline emissionsLarger offset potentialFaster payback months
Stricter carbon rateHigher avoided penaltyImproved circular ROI
Greater reduction efficiencyCompounding annual savingsStronger investment case

Use Carbon Footprint Calculator as the upstream input source for this offset logic.

6

UI Logic Feature 3: Repair vs Replace Toggle

Repair vs replace decision flowchart showing repair option at $200 for 3 years equaling $67 per year and replace option at $1000 for 5 years equaling $200 per year flowing into a compare annual cost decision node with green repair badge winning over dimmed replace badge

A repair recommendation engine should be explicit and fast. The decision rule can be expressed in annualized cost terms and surfaced with a visual recommendation badge.

Rule:

If (Repair Cost / Extension Years) < (New Cost / New Years), recommend REPAIR.

If the inequality fails, recommend REPLACE.

CaseRepair Annualized CostNew Annualized CostRecommendation
$200 repair, +3 years$66.67/year
$1,000 new, 5 years$200/yearREPAIR

This micro-logic is especially effective for electronics, appliances, and office equipment because it turns emotional purchasing decisions into quantitative lifecycle choices.

7

pSEO Modifiers to Scale 100+ Circular Landing Pages

You can scale this cluster by combining product, business context, and intent-led framing. The key is to vary assumptions and examples meaningfully, not just swap keywords.

Modifier AxisValuesTemplate Pattern
By ProductElectric Bikes, Refurbished MacBooks, Solar Batteries, Modular Furniture, Composting SystemsPayback Period for [Product]
By Business TypeCoffee Shops, Dental Clinics, Freelance Studios, Boutique HotelsCircular TCO for [Business Type]
By IntentCost-Benefit of, Carbon ROI of, Hidden Savings in, Payback Period for[Intent] [Product or Business]

This matrix creates high-intent combinations with clear economic framing. Add region overlays and cost tiers to expand further without content duplication risk.

8

Conclusion: Build for Payback Clarity, Not Just Green Claims

Circular adoption grows fastest when users see the payback month and trust the assumptions behind it. That is why a Circular TCO calculator should prioritize transparency on residual value, maintenance savings, and carbon offsets.

The winning 2026 experience is not just "sustainable." It is financially legible, scenario-based, and decision-ready for both households and operators.

Frequently Asked Questions

What is the difference between TCO and circular savings?

TCO tracks the full ownership cost over time, including acquisition, operation, and end-of-life value. Circular savings is the cost gap between a linear ownership model and a circular model that includes repair, resale, and longer lifespan.

How do I calculate payback period for a circular investment?

Divide net upfront circular premium by annual net savings. Net savings should include maintenance reduction, energy savings, and any carbon penalty avoidance if relevant.

Why does residual value matter so much in circular ROI?

Residual value directly lowers effective lifecycle cost because you recover part of the purchase price at exit. In high-value durable products, this can shift a borderline investment into a clearly positive ROI case.

Can carbon tax offsets change the investment decision?

Yes. In carbon-priced environments, avoided penalties can materially reduce circular ownership cost and accelerate payback. This is especially important for energy-intensive SMEs and facilities.

When should I repair instead of replace?

Use the annualized cost rule: if repair cost divided by extension years is lower than new cost divided by new lifespan, repair is economically better. This rule creates a fast and objective recommendation.

What is a realistic payback window for circular upgrades in 2026?

Many practical upgrades target 18 to 60 months depending on asset class, utilization, and incentives. Energy projects with rebates and high usage often sit at the faster end of that range.

Author Spotlight

The Calculory Team

Circular Economy and ROI Analysis

We build practical calculators that turn sustainability choices into measurable financial decisions for households and operators.

Verified Expert Educator
circular economy calculatortco vs circular savingspayback period calculatorcircular roisustainable investment analysisrepair vs replacecarbon tax offsetlifecycle cost modelcircular business casegreen finance2026