1
Why Solar Payback Math Got Sharper in 2026
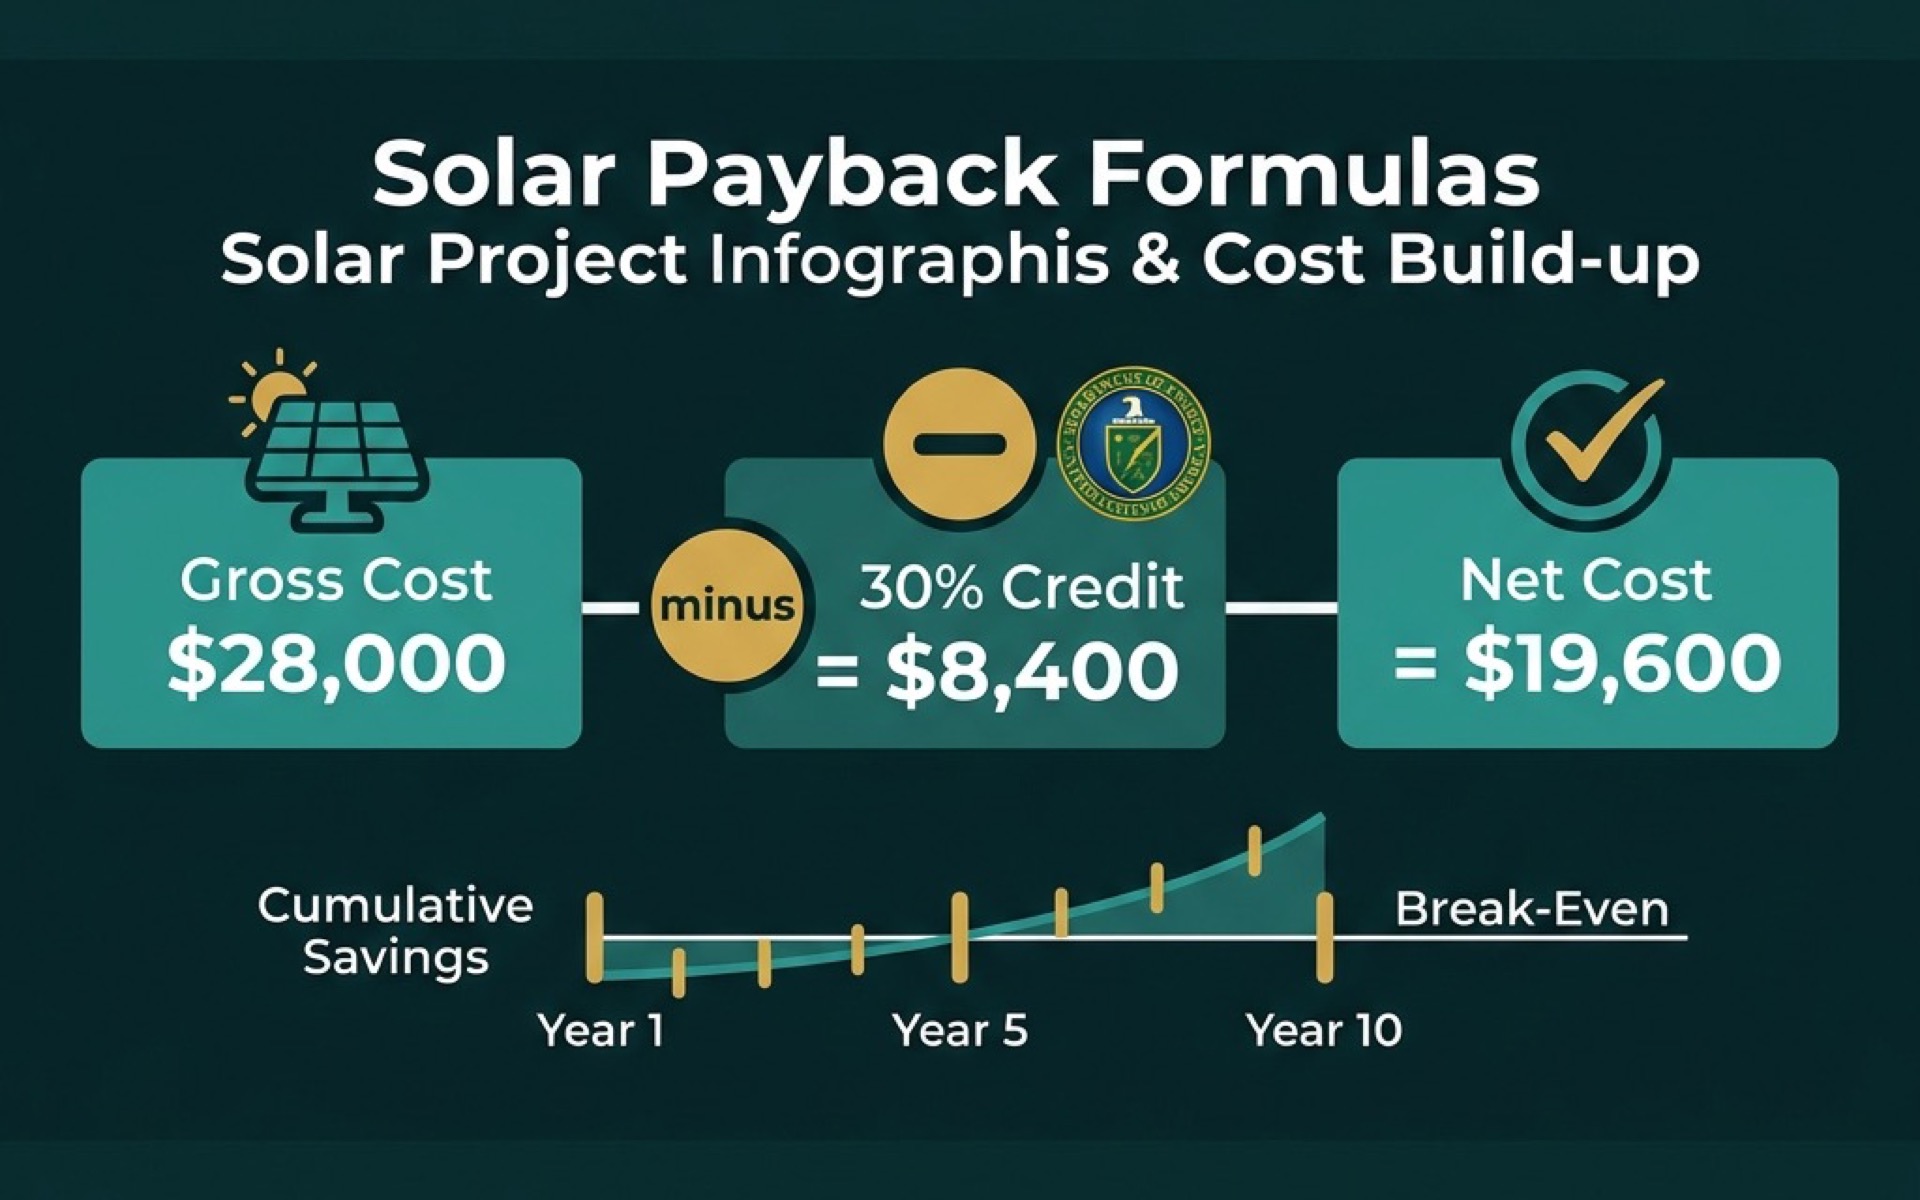
Solar in 2026 is a different decision than it was three years ago. Installed costs have stabilized at $2.80 to $4.00 per watt nationally. The federal Residential Clean Energy Credit is locked at 30 percent through 2032, with no income cap and no maximum credit amount. Most states have either net metering (full retail credit) or net billing (wholesale credit), and the difference is huge for payback math.
The shift means buyers now get accurate quotes within a $2,000 range, but they still see wildly different payback claims. The reason: most online estimators ignore three real variables.
| Variable Often Skipped | Annual Effect | Why It Matters Over 25 Years |
|---|---|---|
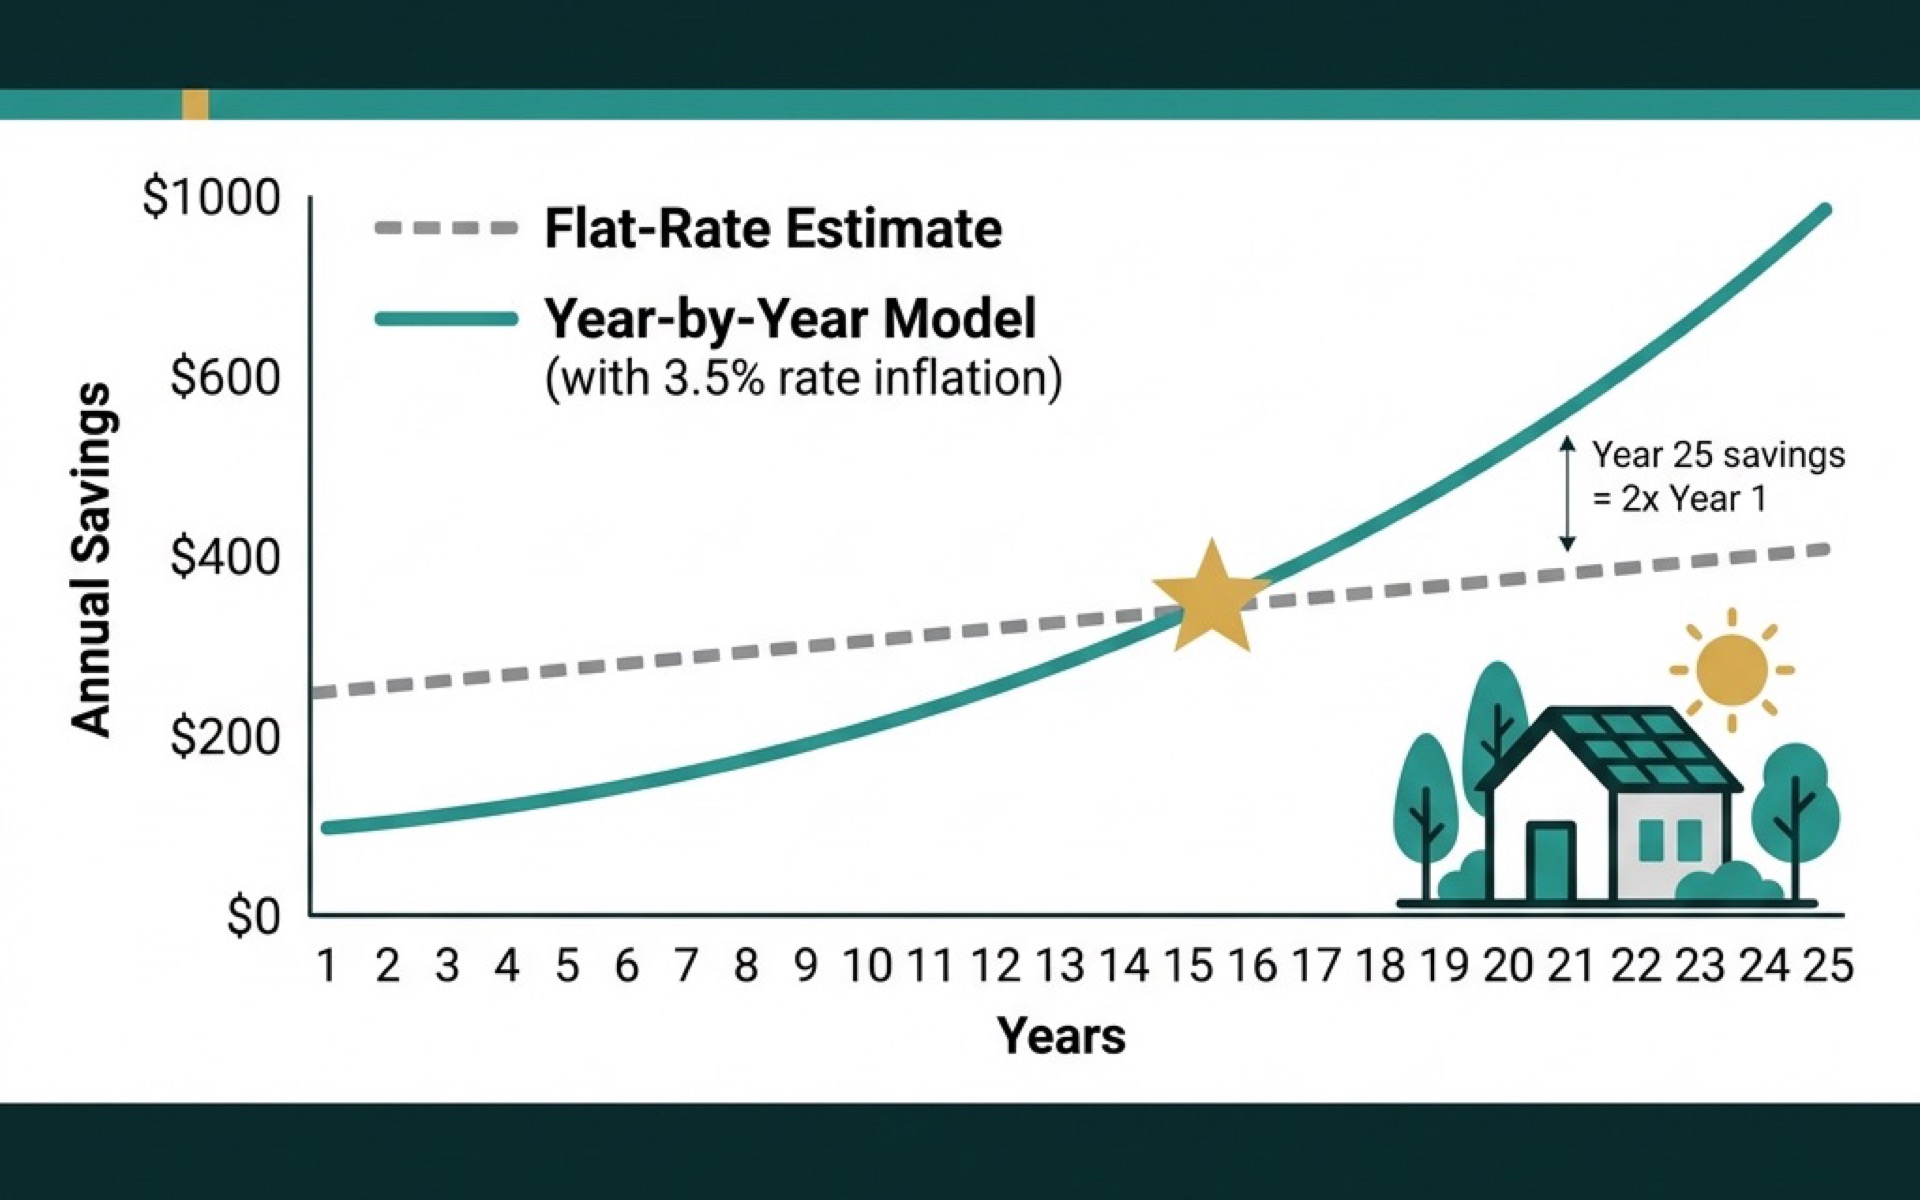
| Electricity rate inflation | +3 to 4 percent per year | Year 25 savings are 2.5x year 1 savings |
| Panel degradation | -0.5 percent per year | Year 25 production is 87 percent of year 1 |
| Maintenance and inverter | $100 to $300 per year | Inverter replacement at year 12 to 15 |
Use the Solar Payback Calculator to model all three and see your exact payback in months.