Business8 min readUpdated May 6, 2026

How to Calculate Profit Margin: Step-by-Step Formulas with Worked Examples

The Calculory Team

Content and Research

Step-by-step profit margin formulas with real numbers. Covers gross, operating, and net margins with worked examples and the common mistakes that inflate results.

How to Calculate Profit Margin: Step-by-Step Formulas with Worked Examples

Key Takeaways

  • Profit margin measures how much of each dollar in revenue a business keeps as profit. A 20% net margin means you keep $0.20 from every dollar earned.
  • There are three types: gross margin (after COGS), operating margin (after overhead), and net margin (after all expenses including taxes).
  • The basic formula is (Profit / Revenue) x 100, but which profit figure you use changes the result dramatically.
  • Profit margin and markup are not the same. A 50% markup only produces a 33.3% margin, and confusing them can cost thousands per year.
  • Good margins vary by industry: grocery runs 1-3% net, restaurants 3-9%, SaaS 20-40%, and luxury goods 10-20%.
  • Tracking margins monthly catches cost creep early. A 2 percentage point quarterly decline demands immediate investigation.

Quick Answer: How to Calculate Profit Margin

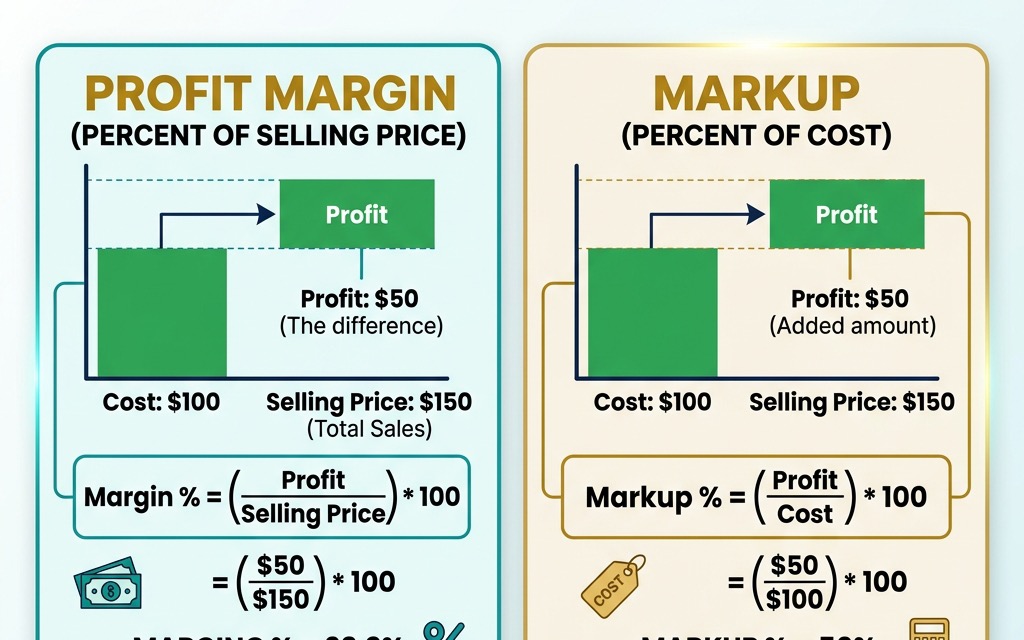
To calculate profit margin, divide profit by revenue and multiply by 100. The basic formula is Profit Margin = (Profit / Revenue) x 100. For a business with $150,000 in revenue and $16,500 in net profit, the net margin is ($16,500 / $150,000) x 100 = 11%.

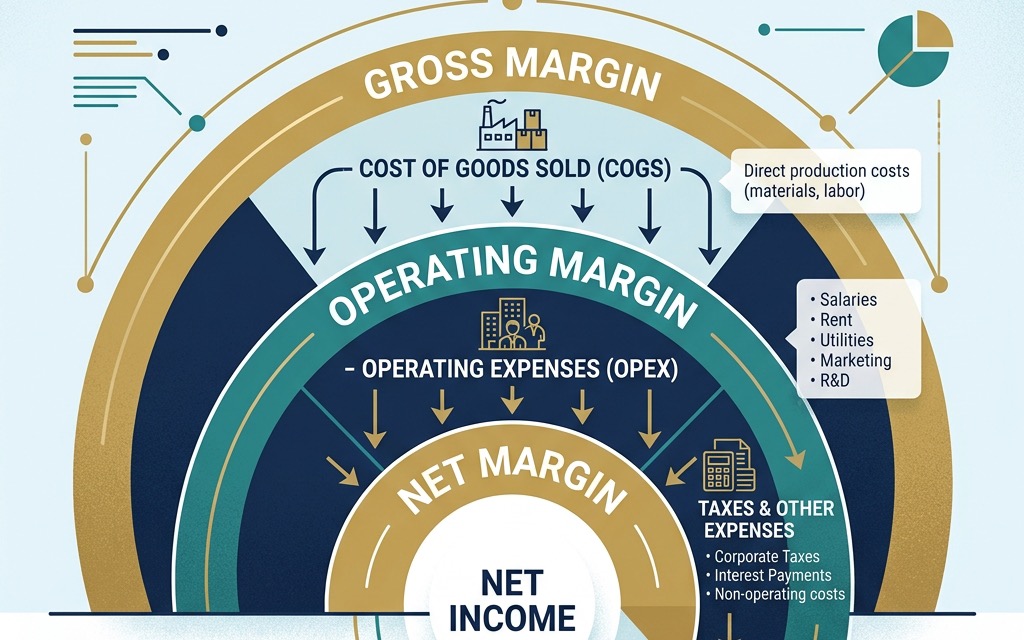
Which profit figure you use changes the result. Use gross profit (revenue minus COGS) for gross margin, operating profit (after overhead) for operating margin, and net profit (after every expense including interest and taxes) for net margin.

The Three Formulas at a Glance

Margin TypeFormula$150K Revenue Example
Gross(Revenue - COGS) / Revenue x 100($150K - $90K) / $150K = 40%
Operating(Revenue - COGS - OpEx) / Revenue x 100($150K - $125K) / $150K = 16.7%
NetNet Income / Revenue x 100$16,500 / $150K = 11%

The 30-second rule: Track all three margins together. A healthy gross margin with a weak net margin signals overhead or debt problems. Scroll down for full step-by-step walkthroughs and industry benchmarks. To run your own numbers right now, use the Profit Margin Calculator.

What is Profit Margin?

Profit margin is a financial metric that tells you what percentage of your revenue is actual profit. It answers a simple question: for every dollar your business earns, how many cents do you keep after paying expenses?

Why Profit Margin Matters

Who Uses ItWhat They LearnWhy It Matters
Business ownersHow efficiently the business converts revenue to profitIdentifies pricing problems and cost creep before they become crises
InvestorsHow profitable a company is relative to its revenueEnables comparison between companies of different sizes
LendersWhether the business generates enough profit to service debtDetermines loan approval and interest rates
ManagersWhich product lines or departments are most profitableGuides resource allocation and strategic decisions

A company can generate millions in revenue but still lose money if costs are too high. Profit margin cuts through raw revenue numbers and reveals the true efficiency of a business.

Use our Profit Margin Calculator to instantly find your margin from any revenue and cost figures. Enter your numbers and see gross, operating, and net margins in seconds.

The Three Types of Profit Margin

A professional diagram showing the hierarchy of Gross, Operating, and Net margins, illustrating how each layer of costs reduces profitability.

Each type of profit margin reveals a different layer of your business finances. Think of them as peeling back an onion, with each layer showing more of the cost picture.

Gross, Operating, and Net Margin Compared

Margin TypeFormulaWhat It MeasuresExample ($150K Revenue)
Gross Margin(Revenue - COGS) / Revenue x 100Production efficiency($150K - $90K) / $150K = 40%
Operating Margin(Revenue - COGS - OpEx) / Revenue x 100Operational efficiency($150K - $90K - $35K) / $150K = 16.7%
Net MarginNet Income / Revenue x 100Overall profitability$16,500 / $150K = 11%

What Each Margin Includes and Excludes

Cost CategoryGross MarginOperating MarginNet Margin
Raw materials and inventoryIncludedIncludedIncluded
Direct labor (production)IncludedIncludedIncluded
Shipping to warehouseIncludedIncludedIncluded
Rent and utilitiesExcludedIncludedIncluded
Salaries (non-production)ExcludedIncludedIncluded
Marketing and advertisingExcludedIncludedIncluded
Interest on loansExcludedExcludedIncluded
Income taxesExcludedExcludedIncluded
DepreciationExcludedExcludedIncluded

Track all three margins together. A healthy gross margin but weak net margin indicates overhead or debt problems. A declining gross margin with stable net margin may mean you successfully cut operating costs to compensate for rising input prices.

How to Calculate Gross Profit Margin: Step by Step

Let us walk through a practical example with an online store that generated $150,000 in revenue last quarter.

Gross Margin Calculation Walkthrough

StepActionCalculationResult
1Determine total revenueTotal sales for the quarter$150,000
2Calculate COGSWholesale + shipping + packaging$90,000
3Find gross profit$150,000 - $90,000$60,000
4Divide by revenue$60,000 / $150,0000.40
5Convert to percentage0.40 x 10040%

Your gross profit margin is 40%. For every dollar of revenue, you keep $0.40 after covering direct product costs. The remaining $0.60 goes to COGS.

What 40% Gross Margin Actually Means

This does not mean 40% of revenue is pure profit. You still need to pay rent, salaries, marketing, and taxes from that $60,000. But it tells you that your product pricing and sourcing is reasonably efficient. If this number starts declining quarter over quarter, it signals that input costs are rising faster than your prices.

Run your own numbers with the Profit Margin Calculator. Enter your revenue and COGS to see your gross margin instantly, then experiment with different pricing scenarios.

How to Calculate Net Profit Margin: Step by Step

Net margin gives you the complete profitability picture. Here is the same business with all expenses included.

Net Margin Calculation: Full Expense Breakdown

Expense CategoryAmountPercentage of Revenue
Revenue$150,000100%
Cost of Goods Sold (COGS)-$90,00060.0%
Gross Profit$60,00040.0%
Operating Expenses (rent, salaries, marketing)-$35,00023.3%
Operating Profit$25,00016.7%
Interest on loans-$3,0002.0%
Income taxes-$5,5003.7%
Net Profit$16,50011.0%

After paying every single expense, you keep 11 cents from every dollar earned. Compare this to the 40% gross margin: the 29 percentage point gap represents your operating costs, interest, and taxes.

Why the Gap Between Gross and Net Matters

MarginThis BusinessHealthy Retail BenchmarkAssessment
Gross Margin40%40-50%On track
Operating Margin16.7%10-20%Healthy
Net Margin11%5-10%Above average

Net margin is the figure investors care about most because it reflects the actual money available for reinvestment, debt repayment, or owner distributions. Track it quarterly with the Gross Profit Calculator.

Profit Margin vs Markup: The Costly Difference

A side-by-side comparison diagram showing the same $50 profit on a $100 cost, illustrating how it results in a 33.3% margin versus a 50% markup.

Profit margin and markup are related but not interchangeable. Confusing them is one of the most expensive pricing mistakes a business can make.

Same Product, Different Percentages

MetricFormulaCalculation ($60 cost, $100 price)Result
MarginProfit / Selling Price$40 / $10040%
MarkupProfit / Cost$40 / $6066.7%

The Underpricing Trap

Suppose you need a 50% profit margin and your product costs $60 to produce.

ApproachFormulaSelling PriceActual MarginLost Per Unit
Correct: 50% margin$60 / (1 - 0.50)$12050.0%$0
Wrong: 50% markup$60 x 1.50$9033.3%-$30

By confusing the two, you underprice by $30 per unit. Sell 1,000 units per month, and that mistake costs $30,000 per month in lost revenue.

Quick Conversion Reference

MarginEquivalent MarkupMarkupEquivalent Margin
20%25%25%20%
25%33.3%50%33.3%
33.3%50%75%42.9%
40%66.7%100%50%
50%100%150%60%
60%150%200%66.7%

For a deeper dive into this topic with more examples, read our complete guide: Markup vs Margin: What is the Difference and Why It Matters. You can also use the Markup Calculator to convert between the two instantly.

Good Profit Margins by Industry: 2026 Benchmarks

There is no universal good profit margin because profitability varies dramatically across industries. What counts as excellent in grocery retail would be considered poor in software.

Net Profit Margin Benchmarks by Industry

IndustryGross MarginNet MarginKey Factor
Grocery and Supermarkets25-30%1-3%Razor-thin margins, high volume compensates
Restaurants60-70%3-9%Labor and rent consume most of gross margin
Retail (general)40-50%3-5%E-commerce slightly higher due to lower overhead
Manufacturing30-40%5-10%Automation level and product type drive variance
Healthcare Services50-65%5-15%Specialized and elective services yield higher margins
Financial Services60-80%15-25%Scale and recurring revenue create high efficiency
Technology and SaaS70-85%20-40%Near-zero marginal cost per additional customer
Luxury Goods60-80%10-20%Premium branding supports high markup
Construction15-25%2-6%High project values, intense bid competition
Consulting and Services50-70%15-25%Labor is the primary cost, low capital needs

Always benchmark within your specific industry. A 5% net margin is excellent for a restaurant but a warning sign for a SaaS company. Startups may run at lower margins while investing in growth, which is acceptable if there is a clear path to profitability. Use the Gross Profit Calculator to compare your margins against these benchmarks.

Five Common Profit Margin Mistakes and Their Cost

Mistake 1: Confusing Margin with Markup

As shown above, this always results in underpricing. A 50% markup only produces a 33.3% margin. On $100,000 in annual sales, this confusion can cost $16,700 in lost profit.

Mistake 2: Forgetting Hidden Costs in COGS

Commonly Forgotten CostTypical ImpactEffect on Margin
Payment processing fees (2.5-3%)$2,500 per $100K revenue-2.5 percentage points
Returns and refunds (2-5%)$2,000-$5,000 per $100K-2 to -5 points
Shipping and fulfillment$3,000-$8,000 per $100K-3 to -8 points
Packaging materials$500-$2,000 per $100K-0.5 to -2 points
Inventory shrinkage (1-2%)$1,000-$2,000 per $100K-1 to -2 points

These hidden costs can reduce your actual margin by 9 to 20 percentage points below what you calculated using only obvious costs.

Mistake 3: Using Gross Revenue Instead of Net Sales

If your business has significant returns or discounts, gross revenue overstates your margin. Always use the amount you actually collected.

Mistake 4: Ignoring Margin Trends Over Time

A single margin snapshot is less useful than a trend. A slowly declining margin might not alarm you in one quarter, but a two-year downward trend demands immediate action. Review margins monthly and investigate any quarter-over-quarter decline greater than 2 percentage points.

Mistake 5: Comparing Margins Across Different Industries

A 5% net margin does not mean two companies are equally efficient if one is a grocery chain and the other is a SaaS platform. Always benchmark within your own industry and business size.

Avoid these mistakes by running every pricing decision through the Profit Margin Calculator before committing. Two minutes of calculation can save thousands in lost profit.

How to Improve Your Profit Margin

Improving profit margin comes down to two levers: increasing revenue per unit or decreasing costs. Here are the most effective strategies ranked by typical impact.

Margin Improvement Strategies by Impact

StrategyLeverTypical Margin ImpactImplementation Difficulty
Raise prices 5-10%Revenue+3 to +8 pointsLow
Negotiate supplier termsCost+2 to +5 pointsMedium
Eliminate low-margin productsBoth+3 to +7 pointsMedium
Automate repetitive tasksCost+2 to +4 pointsMedium to High
Reduce customer acquisition costCost+1 to +3 pointsMedium
Improve retention (reduce churn)Revenue+2 to +5 pointsMedium
Optimize shipping and fulfillmentCost+1 to +3 pointsLow to Medium

The Price Increase Test

Many businesses underprice out of fear. Test a small price increase of 5-10% on a subset of products and measure the impact on volume. In most cases, the revenue increase per unit more than compensates for any slight volume decrease.

ScenarioPriceUnits SoldRevenueMargin
Before (current pricing)$501,000$50,00030%
After 10% increase, 5% volume drop$55950$52,25036.4%
Net improvement+$2,250+6.4 points

Monitor margins monthly. Set up a dashboard tracking gross, operating, and net margins. Use the Profit Margin Calculator to model scenarios before making any pricing or cost changes. Catching a negative trend early gives you time to course-correct.

Using the Profit Margin Calculator

Understanding formulas is important, but manually calculating margins for every pricing decision is impractical. Our free calculator automates the math and eliminates errors.

Calculator Workflow for Complete Margin Analysis

  1. 1.Find your gross margin: Enter total revenue and COGS into the Profit Margin Calculator to see your gross margin instantly
  2. 2.Check your markup: Use the Markup Calculator to verify your pricing produces the margin you intended
  3. 3.Analyze total profitability: Enter revenue and all expenses into the Gross Profit Calculator for your net margin
  4. 4.Model scenarios: Adjust inputs to see what happens if costs rise 10% or you increase prices 5%
  5. 5.Compare against benchmarks: Reference the industry table above to see where you stand
  6. 6.Test discount impact: Use the Discount Calculator to understand how promotions affect your margin before running them

When to Recalculate Your Margins

Trigger EventActionTool
Supplier raises pricesRecalculate margin, consider passing cost to customersProfit Margin Calculator
Launching a new productSet price based on target margin, not gut feelingMarkup Calculator
Planning a promotionModel discount impact on margin before committingDiscount Calculator
End of quarterCompare actual vs target margin across all product linesGross Profit Calculator
Competitor changes pricesReverse-engineer their margin to understand their strategyProfit Margin Calculator

The bottom line: Start with margin targets based on industry benchmarks, use the calculators to set prices that hit those targets, and review actual margins monthly to catch any drift. Data-driven pricing consistently outperforms gut instinct.

Frequently Asked Questions

What is a good profit margin for a small business?

A good net profit margin varies by industry. Restaurants typically achieve 3-9%, retail stores 5-10%, professional services 15-25%, and software companies 15-30%. A net margin above 10% is generally considered healthy for most small businesses.

How do you calculate gross profit margin?

Gross Profit Margin = ((Revenue - Cost of Goods Sold) / Revenue) x 100. If you sell a product for $50 and it costs $30 to make, your gross margin is (($50 - $30) / $50) x 100 = 40%.

What is the difference between gross margin and net margin?

Gross margin only subtracts direct production costs (materials, labor) from revenue. Net margin subtracts all expenses including rent, salaries, marketing, taxes, and interest. A business can have a 60% gross margin but only a 10% net margin after all operating costs are deducted.

How is profit margin different from markup?

Margin uses selling price as the denominator, while markup uses cost. A product bought for $60 and sold for $100 has a 40% margin ($40/$100) but a 66.7% markup ($40/$60). They always produce different percentages from the same transaction, and confusing them leads to systematic underpricing.

What profit margin does Amazon have?

Amazon operates with a net profit margin of approximately 3-7%, which is typical for e-commerce and retail. However, its cloud computing division (AWS) operates at roughly 25-30% operating margin. Many large retailers like Walmart and Costco also have thin net margins of 2-3%, relying on massive volume.

How can I improve my profit margin without raising prices?

Reduce cost of goods sold by negotiating supplier discounts or buying in larger quantities. Cut operational waste by automating repetitive tasks. Optimize your product mix by promoting higher-margin items. Reduce employee turnover (hiring costs 30-50% of an annual salary). Even a 2% margin improvement on $500,000 in revenue adds $10,000 to your bottom line.

Author Spotlight

The Calculory Team

Content and Research

We help business owners and entrepreneurs understand profitability metrics with data-driven tools and clear explanations.

Verified Expert Educator
profit margin calculatorhow to calculate profit margingross profit marginnet profit marginoperating profit marginprofit margin formulaprofit margin by industrymarkup vs marginbusiness profitabilitypricing strategy