The 2026 Housing Market: A New Financial Reality
The housing market of 2026 has entered a rebalancing phase. The era of sub-3% mortgage rates and frenzied bidding wars is over. Instead, 30-year fixed rates have stabilized between 6.0% and 6.5%, inventory has recovered to near pre-pandemic levels in many regions, and both buyers and renters face a more complex financial equation than at any point in the last decade. For many people, the question 'Should I rent or buy?' is no longer about culture or status. It is about pure financial math. The answer depends on your timeline, your local market, your career trajectory, and your ability to absorb the full cost of ownership, not just the mortgage payment.
How 2026 Compares to Previous Markets
| Market Factor | 2021 (Peak) | 2023 (Correction) | 2026 (Current) |
|---|---|---|---|
| 30-Year Fixed Rate | 2.9% - 3.2% | 6.7% - 7.2% | 6.0% - 6.5% |
| Median Home Price | $347,500 | $389,800 | $412,000 |
| Monthly Payment ($400K, 10% down) | $1,517 | $2,352 | $2,271 |
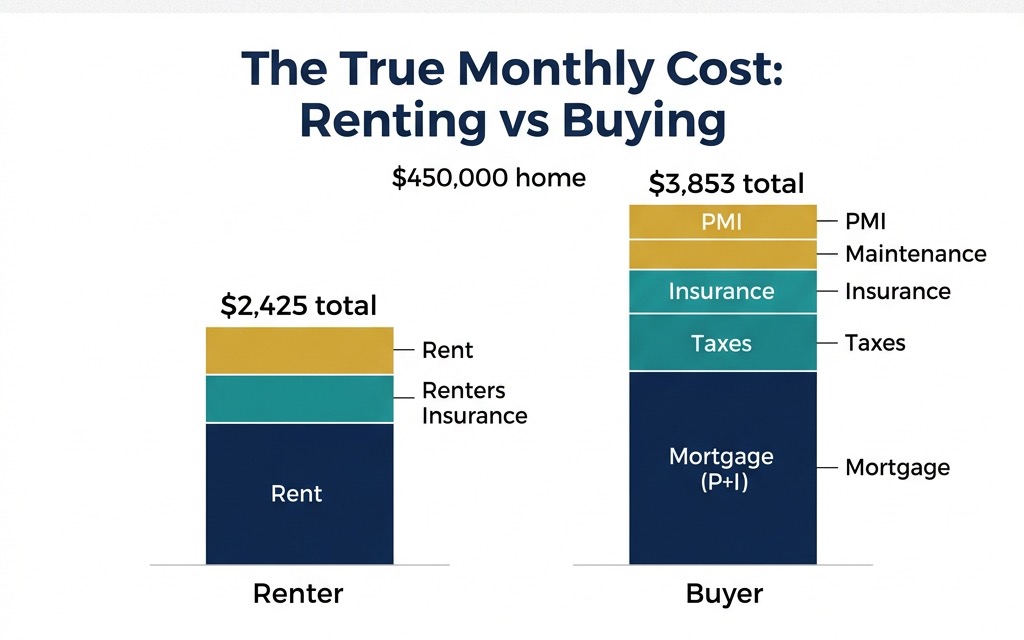
| Median Rent (3-Bed) | $1,850 | $2,100 | $2,250 |
| Housing Inventory (months) | 1.6 | 3.1 | 4.2 |
The monthly mortgage payment on a $400,000 home at 6.25% is $754 more per month than the same home at 3.0%. Over 30 years, that rate difference adds over $271,000 in total interest paid. Use our Mortgage Calculator to see how today's rates affect your specific scenario.